With the third year of the COVID pandemic well underway and as the second year of the Biden administration commences, Americans are becoming less trusting of traditional authority figures, a new survey from the Pew Research Center.
Trust of scientists and the military remains relatively high, although core support for the military drop the most sharply of all groups, while confidence in journalists, business executives, and politicians nears rock bottom.
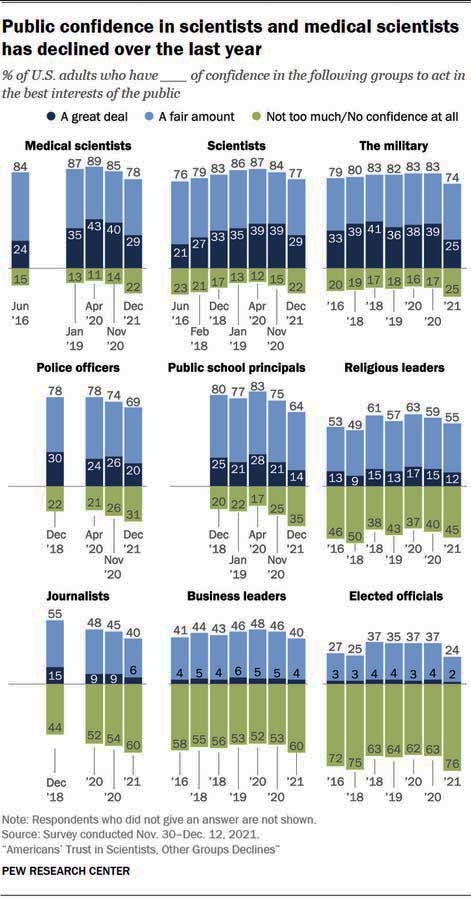
Americans’ confidence in groups and institutions has turned downward compared with just a year ago. Trust in scientists and medical scientists, once seemingly buoyed by their central role in addressing the coronavirus outbreak, is now below pre-pandemic levels.
Overall, 29% of U.S. adults say they have a great deal of confidence in medical scientists to act in the best interests of the public, down from 40% who said this in November 2020. Similarly, the share with a great deal of confidence in scientists to act in the public’s best interests is down by 10 percentage points (from 39% to 29%), according to a new Pew Research Center survey.
The new findings represent a shift in the recent trajectory of attitudes toward medical scientists and scientists. Public confidence in both groups had increased shortly after the start of the coronavirus outbreak, according to an April 2020 survey. Current ratings of medical scientists and scientists have now fallen below where they were in January 2019, before the emergence of the coronavirus.
Scientists and medical scientists are not the only groups and institutions to see their confidence ratings decline in the last year. The share of Americans who say they have a great deal of confidence in the military to act in the public’s best interests has fallen 14 points, from 39% in November 2020 to 25% in the current survey. And the shares of Americans with a great deal of confidence in K-12 public school principals and police officers have also decreased (by 7 and 6 points, respectively).
Large majorities of Americans continue to have at least a fair amount of confidence in medical scientists (78%) and scientists (77%) to act in the public’s best interests. These ratings place them at the top of the list of nine groups and institutions included in the survey. A large majority of Americans (74%) also express at least a fair amount of confidence in the military to act in the public’s best interests. Roughly two-thirds say this about police officers (69%) and K-12 public school principals (64%), while 55% have at least a fair amount of confidence in religious leaders.
The public continues to express lower levels of confidence in journalists, business leaders and elected officials, though even for these groups, public confidence is tilting more negative. Four-in-ten say they have a great deal or a fair amount of confidence in journalists and business leaders to act in the public’s best interests; six-in-ten now say they have not too much or no confidence at all in these groups. Ratings for elected officials are especially negative: 24% say they have a great deal or fair amount of confidence in elected officials, compared with 76% who say they have not too much or no confidence in them.
With trust in leading institutional leaders plunging, it’s no wonder that populism flourishes. . .
Nearly six in 10 Americans, 58%, are dissatisfied with the level of immigration into the U.S. today, while 34% are satisfied. This marks an eight-percentage-point increase in dissatisfaction since last year and a return to the 2019-2020 range.
The 58% dissatisfied includes 35% of all Americans who would prefer that immigration be decreased, 9% increased, and 14% who want levels kept the same. Last year, those dissatisfied were about equally as likely to favor an increase as a decrease, but now the predominant view among the dissatisfied is for less immigration. The proportion who want less immigration has nearly doubled from 19% in 2021 and is well above where it was in 2019 (23%) and 2020 (25%). At the same time, calls for more immigration into the country have dropped.
Following up on today’s earlier post reporting that women die more frequently than men under the care of male surgeons, CBC News in Canada reports of yet another study, this one revealing that black babies die at significantly higher rates when given hospital care by White physicians than when Black doctors oversee their care:
For Black babies, the race of their first doctors can be a matter of life and death.
The researchers looked at 1.8 million hospital birth records in Florida between 1992 and 2015, and found Black babies were three times more likely to die in hospital than white babies.
But when Black infants received care from a Black doctor, that disparity was cut by 39 to 58 per cent — whether the doctor was providing care before, during or after childbirth.
The same was not true in reverse. A doctor’s race has little to no impact on the health of a white infant, the study found.
Here’s a quote from the report:
[T]he mortality penalty for Black newborns treated by White physicians is 56% larger in hospitals managing a large number of Black newborns. This suggests, all else equal, that Black physicians are not performing better as the number of Black newborns increases. Instead, it appears that White physicians are underperforming. . . benefit varies with the hospital’s level of experience caring for Black newborns, not with White newborns or newborns in general. In hospital-quarters with large numbers of Black newborns, those born under the care of White physicians experience especially high mortality penalties.
The only possible conclusion is that while medical schools are great at teaching technical skills, they suck at teaching people skills.
Doctors need to taken to school about their own, unquestioned biases.
We would also ,like to see similar studies focusing on class biases as well.
All of which reminds me of a joke I heard from a malpractice attorney years ago”
Q: What’s the difference between God and a doctor?
From the New York Times, based on a report from the Carnegie Endowment for International Peace based on data from Varieties of Democracy Institute, another indication that the United States is teetering on the brink of a precipice [click on the image to enlarge]:
From their report:
[T]he United States is quite alone among the ranks of perniciously polarized democracies in terms of its wealth and democratic experience. Of the episodes since 1950 where democracies polarized, all of those aside from the United States involved less wealthy, less long-standing democracies, many of which had democratized quite recently. None of the wealthy, consolidated democracies of East Asia, Oceania, or Western Europe, for example, have faced similar levels of polarization for such an extended period.
Only two other episodes come close. First, France briefly reached pernicious levels of polarization during its 1968 political crisis, when student protests and union strikes pushed France’s government to the brink of collapse. However, the unrest faded within a few months and the temperature of politics quickly returned to a more normal level with the signing of the Grenelle Accords and the holding of legislative elections in June 1968. The other episode was in Italy between 1971 and 1978, when levels of polarization were just shy of pernicious as the country faced a surge of violence from far-right and far-left terrorist groups. Italy eventually depolarized as the major political parties agreed to jointly address the violence, law enforcement cracked down on terrorism, and public support for extremist movements faded. Italy has been repolarizing in recent years, however, and reached pernicious levels in 2020. Yet neither Italy nor France reached levels of political polarization as high as the United States’ current levels for as long a period. There are no peer analogues for the United States’ current political divisions—and the track record of all democracies does not provide much consolation.
This status as an outlier could stem from a number of features that make the United States both especially susceptible to polarization and especially impervious to efforts to reduce it. One such feature is the durability of identity politics in a racially and ethnically diverse democracy. The United States is not the only such democracy—Brazil and India are large multiracial and multicultural democracies also suffering pernicious polarization, while Canada and Australia are increasingly multicultural but without such levels of polarization. Yet the United States is perhaps alone in experiencing a demographic shift that poses a threat to the white population that has historically been the dominant group in all arenas of power, allowing political leaders to exploit insecurities surrounding this loss of status.
Second, institutional characteristics likely contribute to the sustained severe polarization in the United States. Binary choice is deeply embedded in the U.S. electoral system, creating a rigid two-party system that facilitates binary divisions of society. For example, only five of twenty-six wealthy consolidated democracies elect representatives to their national legislatures in single-member districts. Like the United States, these countries tend to have two-party dominant systems; however, most have also seen new parties rise over the last two decades, a development that has not been mirrored in the United States.
Another institutional factor is the unique combination of a majoritarian electoral system with strong minoritarian institutions in the United States. The Senate is highly disproportionate in its representation, with two senators per state regardless of population, from Wyoming’s 580,000 to California’s 39,500,000 persons. The practices of the Senate also give individual senators unusual authority to single-handedly hold up presidential nominations or debate on legislation, while the filibuster rule enables the minority party to block consideration of legislation that would have a majority vote in favor. These contribute to government gridlock and fuel public disapproval of Congress. Finally, the disproportionality of Senate representation translates to disproportionality in the Electoral College—whose indirect election of the president is again exceptional among presidential democracies.
A third factor contributing to the seemingly entrenched political polarization in the United States is the three-decade-old trend of partisan sorting, in which the two parties reinforce urban-rural, religious-secular, and racial-ethnic cleavages rather than promote cross-cutting cleavages. With partisanship now increasingly tied to other kinds of social identity, affective polarization is on the rise, with voters perceiving the opposing party in negative terms and as a growing threat to the nation. Voters also tend to follow cues from party leaders about policy positions and there is greater homogeneity within parties, impeding the kind of cross-party coalitions common in the past. With such perceptions of threat, voters are more willing to tolerate or even embrace antidemocratic actions by their leaders.
Partisan sorting and rising polarization create a pernicious logic of zero-sum politics that incentivizes behavior undermining democratic institutions and norms. The final year of Donald Trump’s presidency saw the president and his party fuel a false narrative to discredit the electoral process, attempt to overturn the presidential election, and refuse to disavow political violence. All of these factors impede attempts to overcome pernicious polarization and portend an ominous future for American democracy.
And if that’s not bad enough, consider this from Newsweek:
In the biggest indication that he plans to run for president again so far, former President Donald Trump called himself the 47th president during a recent golf outing.
A video posted on Yeshiva World News’ Instagram on Wednesday, showed Trump and a group of people on a golf course, which was identified in the video as Trump National. As Trump sets himself up for a shot, a member of the group noted that the 45th president of the United States was “first on tee.”
“Forty-fifth and 47th,” Trump responded as he turned around.
Trump’s comment was met with applause and excitement from the rest of the golfing group. One person said, “I love it.”
Want to know what the risks of heart disease are in your community?
You could look at a whole range of factors, everything from dietary patterns to economics, and there’s a good chance you’ll find some correlations.
But a team of scientists from the University of Pennsylvania went looking for a new way to assess community risks that tops all the existing means of prediction, and they found it the social medium that has itself become the subject of intense scrutiny in the wake of Donald Trump’s toxic deployment of the medium — Twitter.
Here’s the abstract of their findings, just published in the academic journal Psychological Science [$35 to access for non-subscribers], and available free via this link from from the National Library of Medicine:
Hostility and chronic stress are known risk factors for heart disease, but they are costly to assess on a large scale. We used language expressed on Twitter to characterize community-level psychological correlates of age-adjusted mortality from atherosclerotic heart disease (AHD). Language patterns reflecting negative social relationships, disengagement, and negative emotions—especially anger—emerged as risk factors; positive emotions and psychological engagement emerged as protective factors. Most correlations remained significant after controlling for income and education. A cross-sectional regression model based only on Twitter language predicted AHD mortality significantly better than did a model that combined 10 common demographic, socioeconomic, and health risk factors, including smoking, diabetes, hypertension, and obesity. Capturing community psychological characteristics through social media is feasible, and these characteristics are strong markers of cardiovascular mortality at the community level.
Here’s more from the discussion of their findings at the end of their report:
Our study had three major findings. First, language expressed on Twitter revealed several community-level psychological characteristics that were significantly associated with heart-disease mortality risk. Second, use of negative-emotion (especially anger), disengagement, and negative-relationship language was associated with increased risk, whereas positive-emotion and engagement language was protective. Third, our predictive results suggest that the information contained in Twitter language fully accounts for—and adds to—the AHD-relevant information in 10 representatively assessed demographic, socioeconomic, and health variables
The following chart from their report reveals the specific words reflecting either a stronger risks for atherosclerotic heart disease [top] or for healthier hearts [bottom], Word size indicates relative frequency of use.:
Social media are magnifying lenses focused on our individual and collective psyches, and our choice of words reveals far more than we think.
By freeing up our ability to reveal the darkest and most hate-filled corners of of our hearts, Twitter, Facebook, and the rest may actually be killing us, and hate- and rage-spewing politicians like Donald Trump, Marjorie Taylor Green, and Tucker Carlson [yes, he’s a politician, just not the elected sort], may be literally killing their followers just as surely as their opposition to vaccines and masks is also killingmany of them.
Across the 16 advanced economies surveyed, a median of just 17% consider American democracy a good model for other countries to follow. A median of 57% think it used to be a good example but has not been in recent years. And around a quarter say the U.S. has never been a good example. The belief that democracy in the U.S. has never been a good model for other nations is especially common among young adults.
Here’s a breakdown of their findings in graphic form:
Overall, majorities of Americans are satisfied with five of the societal and policy areas: the nation’s military strength and preparedness (74%), women’s position in the nation (62%), the acceptance of gays and lesbians (55%), security from terrorism (54%) and the quality of medical care (53%). These top-rated issues — particularly military strength — have typically ranked near the top each year since 2001. Acceptance of gays and lesbians has been a high-ranking issue since 2015.
At the other end of the spectrum, a record-low 18% of U.S. adults are satisfied with the nation’s efforts to deal with poverty and homelessness. The poverty and homelessness measure has consistently placed near the bottom of the list, along with campaign finance laws, which was not asked this year. Satisfaction with the state of race relations has been muted since 2015. Crime satisfaction generally has not ranked as low as it does this year.
In addition to efforts to deal with poverty and homelessness, several measures have reached their lowest satisfaction in Gallup’s history: the nation’s policies to reduce or control crime (27%), the position of Black Americans and other racial minorities in the nation (35%), and the quality of the environment (41%).
From the Atlantic, a look at the backgrounds of those arrested in the Capitol insurrection comparing their demographics with those of far-Right figures arrested for previous incidents, first in terms of membership in known radical groups:
And second, contrasting the age profiles of arrestees:
From the report:
In recent weeks, our team of more than 20 researchers has been reviewing court documents and media coverage for information on the demographics, socioeconomic traits, and militant-group affiliations (if any) of everyone arrested by the FBI, Capitol Police, and Washington, D.C., police for offenses related to the January 6 insurrection. As of late last week, 235 people fell into that category, and the number is expected to grow.
Of these suspects, 193 have been charged with being inside the Capitol building or with breaking through barriers to enter the Capitol grounds. We focused our research on these 193. We compared our findings on these suspected insurrectionists with demographic data that we had previously compiled on the 108 individuals arrested by the FBI and local law-enforcement agencies around the country for violence related to right-wing political causes from 2015 to 2020. We used the same methodology to analyze both groups: Our team reviewed all court documents related to each arrest—which include criminal complaints, statement of facts, and affidavits—and conducted searches of media coverage of each arrestee.
Back when we started working in the 1960s, most jobs were limited to eight hours of work perday, with overtime for paid for any additional hours, good health insurance, and company-paid pensions.
But these days, increasing numbers of jobs contain no guaranteed working hours, little or no overtime, no company pensions, and if there’s health insurance at all, much of the costs are borne by workers.
This new vision of work, while rewarding to employers, leaves workers in a state of precarity, with no assurances of a steady income and few, if any, benefits.
So-called precarious employment was once to the province of piece workers and low-end workers, but a new study reveals that precarity is now rising fastest among those once exempt from the angst that forms the constant undertone of lives of those whose hold on economic security is tenuous at bvest.
Study reveals precarious employment on the rise long before COVID-19
A study led by a University of Illinois Chicago researcher uses a new approach to measure precarious, or low-quality, employment in the United States. And, according to those findings, precarious employment has increased 9% between 1988 and 2016.
Precarious employment, or P.E., is defined as low-quality employment, which is often characterized by low wages, job insecurity and irregular hours, making employment risky and stressful for the worker.
In her study, Changes in precarious employment in the United States: A longitudinal analysis [open access], Vanessa Oddo, assistant professor in UIC’s School of Applied Health Sciences, sought to create a multidimensional and continuous measure of P.E. in the U.S. She also set out to describe changes in precarious employment over time, both overall and within subgroups. The paper is published in the Scandinavian Journal of Work, Environment & Health.
A better understanding of long-term trends is a critical first step for informing future policies aimed at improving P.E. and population health in the U.S., Oddo said.
Previously, the focus for measuring P.E. was on wages, hours and union membership. For this longitudinal study, she expanded the measurement criteria to add P.E. indicators including:
● Material rewards — the wage and non-wage benefits afforded by employment.
● Working-time arrangements — the length and intensity of working hours, underemployment and schedule predictability.
● Workers’ rights — describes welfare state provisions associated with employment, such as access to health insurance or pensions.
● Collective organization — the possibilities (or lack thereof) for employee representation, most commonly measured through union representation.
● Interpersonal relations — employees’ power relative to management (e.g., their ability to make decisions or control their schedule) and can include exposure to discrimination.
● Training opportunities — opportunities for promotion or to enhance skills.
Characterizing trends in P.E. using a multidimensional indicator is critical given that employment quality is increasingly recognized as a social determinant of health, according to Oddo.
P.E. can result in insufficient income, which compromises access to food and other necessities; greater exposure to adverse physical working conditions, such as toxic exposure, and limited control over both personal and professional lives, leading to stress.
“Importantly, poor employment quality may be contributing to widening health inequities, as women, people with lower education levels, and minorities have a higher prevalence of P.E.,” Oddo said.
The research revealed P.E. score was significantly higher among people of color, women, people with lower levels of education and people with lower income. Between 1988 and 2016, the overall P.E. scores significantly increased indicating worsening employment quality over time.
However, the study showed the largest increases in P.E. among males, people with a college education, and higher-income individuals.
“These results suggest long-term decreases in employment quality are widespread in the U.S., rather than just confined to marginalized segments of the labor market,” Oddo said.
According to the study, the largest change over time in employment precarity among males and college-educated and higher-income individuals could be because their P.E. score was lower at the study’s beginning in 1988, leaving a greater opportunity for declines. Additionally, the large increase in P.E. among males may also be due to the declining rate of union membership in the U.S., as union membership is associated with better employment quality and, historically, was more common among males.
Oddo said P.E. has been studied more broadly after the 2008 recession when employment quality worsened and there was a notable shift toward contract work and the emergence of the gig economy. She added that there is speculation as to how the COVID-19 pandemic will affect P.E., both during the pandemic and after when work from home measures are lifted.
A holistic approach to studying P.E. is important in the future as data can inform employment policy decisions. For example, a better understanding of P.E. in the U.S. may be helpful for informing future policies around secure scheduling (i.e. advanced notice of schedules) or gig work, like California’s Assembly Bill 5, which changed the rules employers must use to determine whether workers are employees or independent. The distinction is important because independent contractors are not entitled to most of the protections and benefits that employees get, Oddo explained.
Also, precarious employment could slow our ability to get back to work after COVID-19, as precariously employed individuals could face additional barriers to COVID-19 vaccination; for example, if they are undocumented workers or independent contractors.
San Precario: A new patron saint for the American worker
Seventeen years ago, European temporary workers found themselves with a new saint, San Precario.
And as we’ve noted before, Marcel van der Linden, Senior Researcher of International Institute of Social History, described his/her origins in a March 2014 essay in the academic journal Labor Studies in Working-Class History of the Americas:
On February 29, 2004, the Chainworkers of Milan, an Italian anarcho-syndicalist collective seeking to subvert commercial advertising, chose a new saint: San Precario, the patron saint of casual, temporary, freelance, and intermittent workers. San Precario was initially envisaged as a man but has evolved into a rather androgynous being. He or she can appear anywhere and everywhere: on streets and squares, but also in McDonald’s outlets, supermarkets, and bookstores.
Prayers are directed to the new saint, such as:
Oh, Saint Precarious, protector of us all, precarious of the earth Give us paid maternity leave Protect chain store workers, call center angels, and all flexible employees, hanging by a thread Give us paid leave, and pension contributions, income and free services, keep us from being red Saint Precarious, defend us from the bottom of the network, pray for us temporary and cognitive workers Extend to all the others our humble supplication Remember those souls whose contracts are coming to an end, tortured by the pagan divinities: the Free Market and Flexibility those wandering uncertain, without futures or homes with no pensions or dignity Grant hope to undocumented workers and bestow upon them joy and glory Until the end of time
While the androgynous San Precario has largely faded into recesses of cultural history, the ersatz saint perfectly embodies the new American angst as corporations slash workers from their payrolls and reinvent them as “associates,” temps, and “independent contractors,” thereby freeing their corporate masters from costly pensions and health insurance, pesky unions, and labor regulations.
Democrats and Republicans in Congress represent dramatically different constituencies, and these differences track with the changing impact of the coronavirus outbreak over the past nine months. Democrats are far more likely than Republicans to represent urban and diverse constituencies – the places hardest hit early in the pandemic.
Republicans are more likely than Democrats to represent rural areas and districts with higher shares of White residents – the same places that have seen cases and deaths grow in the past three months.
While the total number of COVID-19 deaths in Democratic districts remains higher overall, new deaths have been higher on average in Republican-controlled districts since the end of July. New deaths in Republican controlled districts began increasing in mid-October while they were still falling somewhat overall in Democratically controlled districts. However, since November, deaths have been rising in both Republican and Democratic districts.
Note that the shift in death rates occurred as the Presidential race was heating up. One has to wonder if the rising deaths in Republican districts may have shifted enough votes to assure Trump’s defeat.
Majorities in a new poll support the House action to impeach former President Trump for a second time earlier this month and want the Senate to convict him in his upcoming trial
The survey released Monday from Monmouth University found that 56 percent said they supported the impeachment over Trump’s role in a deadly riot by his supporters at the U.S. Capitol earlier this month. Forty-two percent said they did not support his impeachment.
A slightly smaller majority — 52 percent — said they wanted the Senate to convict Trump, while 44 percent did not want to see a conviction.
“There is somewhat more agreement that Trump did something wrong than there was with the first impeachment. But there are still a good number of Republican stalwarts who continue to stand with the former president regardless,” said the director of the Monmouth University Polling Institute, Patrick Murray.
From Bloomberg, graphic evidence that the world’s coronavirus vaccination program is off to a very slow starts, with vaccination rates low or non-existent in all countries:
The biggest vaccination campaign in history has begun. More than 42.2 million doses in 51 countries have been administered, according to data collected by Bloomberg. The latest rate was roughly 2.43 million doses a day, on average.
<snip>
The Pfizer-BioNTech vaccine has now been cleared for use across North America, Europe and the Middle East, and vaccination campaigns have begun in at least 51 countries. That shot and the vaccine from Moderna were both found to reduce coronavirus infections by 95% in trials of tens of thousands of volunteers. A vaccine by AstraZeneca Plc and University of Oxford got its first major authorization, by the U.K., on Dec. 30.
Other countries got a head start on vaccinations. China and Russia authorized their own shots in July and August, before they’d been fully tested. Since then, the countries have administered millions of doses, though they provide less frequent updates on their progress.
With the start of the global vaccination campaign, countries have experienced unequal access to vaccines and varying degrees of efficiency in getting shots into people’s arms. Israel’s rate of innoculations dwarfs the efforts of other nations, with 25.9 doses administered for every 100 people. Most countries haven’t yet given their first shots.
Judging by the latest survey from the Pew Research Center, Europeans a giving a hearty welcome to Joe Biden:
From the report:
Large majorities in Germany (79%), France (72%) and the UK (65%) say they have confidence in Biden to do the right thing in world affairs – a dramatic change from the low ratings Trump received in a survey conducted in the summer of 2020 in these three nations. As he prepares to begin his presidency, Biden’s ratings are only slightly lower than the ratings Barack Obama received near the end of his second term.
Large majorities also say that, when thinking of the future of their country, they are optimistic about their country’s relations with the U.S., including more than eight-in-ten in Germany and France and roughly seven-in-ten in the UK.
But deep divisions remain:
The second graphic reflects the overall views of the U.S. held in Germany, France and the U.K.:
In the absence of policy particulars, optimism about U.S. policies tends to be more pronounced on the political left than right in France, Germany and the UK. This is particularly true when it comes to America’s response to the coronavirus outbreak. In the UK, people on the left are 16 percentage points more likely than those on the right to say America’s response to the outbreak will get better. In France and Germany, 80% of those on the left vs. 68% of those on the right share this view.
Optimism about policy changes under Biden is also muted among supporters of right-wing populist parties – a segment that tended to express relatively positive views of Trump and his policies. Yet even among these supporters, the prevailing view is that America’s response to the coronavirus pandemic, climate change and overall foreign policy will improve under the new U.S. president. For example, roughly half (51%) of Germans with a favorable view of AfD think the U.S. response to climate change will improve when Biden takes office; in the UK, a 56% majority of Brexit (Reform UK) supporters agree, as do 58% of National Rally backers in France.
Two new polls conducted by major television news divisions reflect a deeply divided and fearful America as America prepares to enter a new administration.
The first poll, conducted for CBS News, is summarized by Politico [emphasis added]:
More than half of all Americans say the greatest danger to America’s way of life comes from their fellow citizens, according to a CBS News poll released Sunday.
A total of 54 percent of those surveyed said that “other people in America, and domestic enemies” posed the “biggest threat” to American society at this point in time ahead of “economic forces” at 20 percent, “the natural world” at 17 percent and “foreign countries” at 8 percent. The category of “natural world” was a catch-all that included hazardous weather and other natural disasters, as well as lethal viruses, a nod to the coronavirus pandemic.
The most pessimistic respondents among those surveyed were those age 65 and older: About two-thirds (66 percent) saw their fellow Americans as the nation’s greatest threat. There was not, however, much difference regardless of age group between Democrats (53 percent) and Republicans (56 percent) on the subject, nor a notable difference between men (53 percent) and women (55 percent).
<snip>
In the aftermath of that insurrection, 51 percent of those surveyed said they expected political violence in the country to increase, and 71 percent said they believed democracy in the United States was “threatened” now, as opposed to 29 percent who thought it was “secure” or “very secure.”
Despite all the pessimism, there were some signs of hope expressed. A total of 58 percent said they were optimistic about Biden’s presidency, which is to begin Wednesday, and 74 percent said they considered him to be the legitimate winner of November’s election.
The second poll, from NBC News reaches similar conclusions.
A majority of American voters in an NBC News poll released one day before President-elect Joe Biden‘s inauguration said they are pessimistic and worried about the U.S.
Fifty-three percent shared the sentiment, while 44 percent said they are optimistic.
NBC noted that this is the first time a majority has described itself as pessimistic since 1988, when pollsters first asked the question.
According to the poll released Tuesday, 73 percent of respondents said they believe the nation is on the wrong track and expect the country to remain divided over the next four years. Just more than 1 in 5 — 21 percent — said they believe it is headed in the right direction.
Seventy-three percent also said they expect the country to remain divided through Biden’s first four years, with only 24 percent predicting increased unity in the years ahead.
From the Pew Research Center comes a major survey on the outgoing and incoming Presidents, with Donald Trump hitting his lowest-ever numbers in the wake of the Capitol assault.
From the report:
As Joe Biden prepares to take office just days after a deadly riot inside the U.S. Capitol, 64% of voters express a positive opinion of his conduct since he won the November election. Majorities also approve of Biden’s Cabinet selections and how he has explained his plans and policies for the future.
Donald Trump is leaving the White House with the lowest job approval of his presidency (29%) and increasingly negative ratings for his post-election conduct. The share of voters who rate Trump’s conduct since the election as only fair or poor has risen from 68% in November to 76%, with virtually all of the increase coming in his “poor” ratings (62% now, 54% then).
Trump voters, in particular, have grown more critical of their candidate’s post-election conduct. The share of his supporters who describe his conduct as poor has doubled over the past two months, from 10% to 20%.
The new survey by Pew Research Center, conducted Jan. 8-12 among 5,360 U.S. adults, including 4,040 who say they voted in the presidential election, finds that a sizable majority of Americans do not want Trump to remain a major political figure after he leaves office. About two-thirds (68%) say Trump should not continue to be a major national political figure for many years to come; just 29% say he should remain a major figure in U.S. politics.
Three other graphics from the report caught our attention,.
The first charts overall approval of Trump’s and Biden’s conduct at the time of the election and after the insurrection:
The second charts how the public assigns responsibility to Trump for the violence of the insurrection, and whether they’d like him to leave office before the inauguration:
And the third reveals that most Republicans remain convinced that Trump the election:
And our final entry reveals that most Americans want to forget Trump:
“Sticks and stones may break my bones but words will never hurt me.” — Children’s saying
“Sticks and stones may break my bones, but words will always hurt me. Bones mend and become actually stronger in the very place they were broken and where they have knitted up; mental wounds can grind and ooze for decades and be re-opened by the quietest whisper.” — Stephen Fry
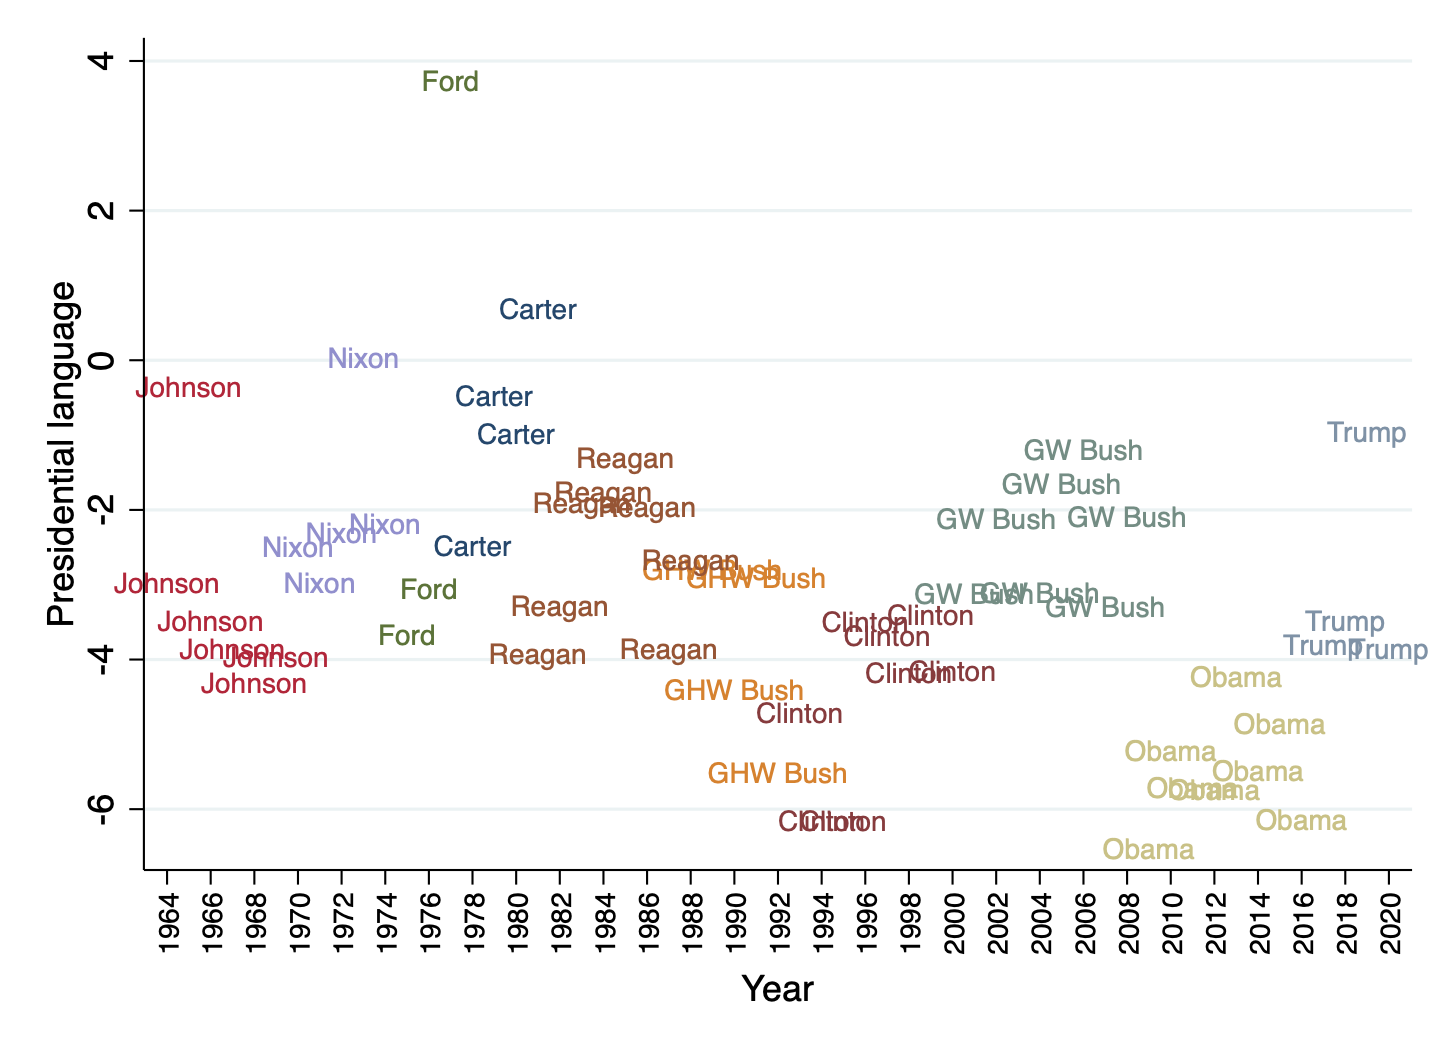
No President has ever deployed violent language against his own people in the way Donald Trump has.
Samira Sarano, Kone Foundation Senior Researcher at the Migration Institute of Finland, examined Trump’s rhetoric in the 2016 election in The Meta-violence of Trumpism, research published in the European Journal of American Studies, an open-access academic journal.
Here’s a telling passage [emphasis added]:
Rather than denouncing violence, Trump frequently praised the “passion” and “energy” of his supporters, and he even promised to pay the legal fees of supporters caught in violent altercations.At a March 4, 2016 rally, he commented on a protestor’s removal: “Try not to hurt him. If you do, I’ll defend you in court. Don’t worry about it.” At times, Trump explicitly condoned the use of violence against protestors. On February 1, 2016, he stated: “If you see someone getting ready to throw tomatoes knock the crap out of them, would you? Seriously. OK. Just knock the hell… I promise you, I will pay for the legal fees.” Though Trump himself wished he could “punch [a protestor] in the face,” he recognized that such tactics were unpopular: “Part of the problem and part of the reason it takes so long [to remove protestors] is that nobody wants to hurt each other anymore.” Trump praised violent action against protestors: “I love the old days, you know? You know what I hate? There’s a guy totally disruptive, throwing punches. We’re not allowed to punch back anymore. I love the old days. You know what they used to do to guys like that when they were in a place like this? They’d be carried out on a stretcher, folks.”
Donald Trump: Aggressive Rhetoric and Political Violence, a more recent study, published in October in the journal Perspectives on Terrorism, was authored by two Columbia University scholars, political scientist and journalist Brigitte L. Nacosis and Wallace S. Sayre Professor of Government and International and Public Affairs Robert Y. Shapiro, and Yaeli Bloch-Elkonis Senior Lecturer/Assistant Professor of Communications and Political Science at Bar Ilan University.
Here’s one key excerpt [emphasis added]:
Examining whether correlations existed between counties that were venues of Donald Trump’s 275 campaign rallies in 2016 and subsequent hate crimes, three political scientists found that “counties that had hosted a 2016 Trump campaign rally saw a 226 percent increase in reported hate crimes over comparable counties that did not host such a rally.” While cautioning that this “analysis cannot be certain it was Trump’s campaign rally rhetoric that caused people to commit more crime in the host county,” the researchers also found it “hard to discount a ‘Trump effect’ since data of the Anti-Defamation League showed “a considerable number of these reported hate crimes referenced Trump.” Moreover, investigative reporting identified 41 cases of domestic terrorism/hate crimes or threats thereof, in which the perpetrators invoked Trump favorably in manifestos, social media posts, police interrogations, or court documents. Almost all of this violence was committed by White males against minorities or politicians singled out frequently by Trump for rhetorical attacks, and journalists. The U.S. Press Freedom Tracker recorded a total of 202 attacks on U.S. journalists from 2017, Trump’s first year in office, through mid-2020.
Trumpspeak and the assault on the Capitol
And now another study parses Trump’s speeches in the lead-up to and in the aftermath of 6 January insurrection at the nation’s Capitol.
Two scholars from the University of Memphis, Roger J. Kreuz, Associate Dean and Professor of Psychology, University of Memphis, and Leah Cathryn Windsor, Research Assistant Professor, parse presidential speech in a report for The Conversation, the open access, plain language academic journal:
How Trump’s language shifted in the weeks leading up to the Capitol riot – 2 linguists explain
On Jan. 6, the world witnessed how language can incite violence.
One after another, a series of speakers at the “Save America” rally at the Ellipse in Washington redoubled the messages of anger and outrage.
This rhetoric culminated with a directive by the president to go to the Capitol building to embolden Republicans in Congress to overturn the results of the 2020 election.
“Fight like hell,” President Donald Trump implored his supporters. “And if you don’t fight like hell, you’re not going to have a country anymore.”
Starting with a speech he made on Dec. 2 – in which he made his case for election fraud – we analyzed six public addresses Trump made before and after the riot at the Capitol building. The others were the campaign rally ahead of the runoff elections in Georgia, the speech he made at the “Save America” rally on Jan. 6, the videotaped message that aired later that same day, his denouncement of the violence on Jan. 7 and his speech en route to Texas on Jan. 12.
Together, they reveal how the president’s language escalated in intensity in the weeks and days leading up to the riots.
Finding patterns in language
Textual analysis – converting words into numbers that can be analyzed as data – can identify patterns in the types of words people use, including their syntax, semantics and vocabulary choice. Linguistic analysis can reveal latent trends in the speaker’s psychological, emotional and physical states beneath the surface of what’s being heard or read.
This sort of analysis has led to a number of discoveries.
Textual analysis continues to offer fresh political insights, such as its use to advance the theory that social media posts attributed to QAnon are actually written by two different people.
The ‘official’ sounding Trump
Contrary to popular thinking, Trump does not universally use inflammatory rhetoric. While he is well known for his unique speaking style and his once-frequent social media posts, in official settings his language has been quite similar to that of other presidents.
Researchers have noted how people routinely alter their speaking and writing depending on whether a setting is formal or informal. In formal venues, like the State of the Union speeches, textual analysis has found Trump to use language in ways that echo his predecessors.
In addition, a recent study analyzed 10,000 words from Trump’s and President-elect Joe Biden’s campaign speeches. It concluded – perhaps surprisingly – that Trump and Biden’s language was similar.
Both men used ample emotional language – the kind that aims to persuade people to vote – at roughly the same rates. They also used comparable rates of positive language, as well as language related to trust, anticipation and surprise. One possible reason for this could be the audience, and the persuasive and evocative nature of campaign speeches themselves, rather than individual differences between speakers.
After studying Trump’s speeches before the storming of the Capitol building, we found some underlying patterns. If it seemed there was a growing sense of momentum and action in his speeches, it’s because there was.
Nearly a third of Black U.S. military servicemembers reported experiencing racial discrimination, harassment or both during a 12-month period, according to results of a long-withheld Defense Department survey that underscore concerns about racism in the ranks.
The 2017 survey, whose results have not previously been reported, also showed that U.S. troops who experienced racial discrimination or harassment had high levels of dissatisfaction with the complaint process and largely did not report it.
The data support the findings of a 2020 Reuters investigation here, which found that servicemembers feared that reporting discrimination would likely backfire and was not worth the risk.
“Overall, results reveal much work is needed to improve the reporting process for those who experience racial/ethnic harassment and discrimination,” the Defense Department acknowledged in a report that accompanied the survey data.
The Pentagon’s release of the data followed a Reuters article last month here disclosing how the Defense Department sat on the 2017 survey data during President Donald Trump’s administration, even last month denying a Reuters Freedom of Information Act Request.
A year ago, a rare thing happened to American women.
For three months, they held more jobs than men in the US economy — something that had only occurred one other time in history, during a short period in 2009 and early 2010. Sure, there were still many other gender gaps: women were more likely than men to work part-time, for example, because of caregiving responsibilities at home, and even among full-time workers, they earned on average only 81 cents for every dollar of their male peers.
Nevertheless, women were making gradual gains.
The pandemic quickly changed that story. And now, it just got worse.
According to new data released Friday, employers cut 140,000 jobs in December, signaling that the economic recovery from the coronavirus pandemic is backtracking. Digging deeper into the data also reveals a shocking gender gap: Women accounted for all the job losses, losing 156,000 jobs, while men gained 16,000.
From The Economist, a graphic account of Trump’s Tweets:
[The title they gave the chart is in Latin, with the first three words uttered by Julius Caser. Veni = I came, vidi = I saw, and vinci = I conquered. That fourth bit of Latin, perdidi was inapplicable to Caesar until the Ides of March, 44 B.C., and means “I lost.”]
From the article, which logs Trump Tweets from his very first, on 4 May 2009:
He tweeted just 142 times in 2010 and 772 times in 2011; in 2012, after embracing the bogus conspiracy theory that Barack Obama was born outside the United States, he posted to the account 3,523 times; by 2013 he was up to 8,128 tweets, or 156 a week. But the rigours of the presidency eventually took their toll. After the election in 2016 Mr Trump’s social-media activity plummeted. He did not return to his previous level of output until 2020, when he tweeted 6,280 times and retweeted 5,956 times, more than in any other year.
A second chart follows his use of emotionally charged words in his Tweets:
From the report:
His tone has changed, too, according to an analysis by The Economist. Using a lexicon of 14,182 English words compiled by Saif Mohammad and Peter Turney, two Canadian computer scientists, we counted the number of words in Mr Trump’s 46,694 tweets associated with particular emotions, such as surprise or sadness.
By this measure, joyful terms initially outnumbered fearful and angry ones; in 2015 they did so by a ratio of two to one. But anger and fear consistently won out by 2018—a year in which Mr Trump taunted North Korea’s dictator, Kim Jong Un, over the size of his “nuclear button”, warned Iran’s president Hassan Rouhani not to threaten America lest he “suffer consequences”, and raged against the “witch-hunt” led by Robert Mueller, the special counsel. Since then, by our count, angry and fearful words have totalled 9,152 and 9,173, respectively—and joyous ones just 7,483. His fiercest tweet came in September 2020, just weeks before the election, when he denounced America’s mail-in voting system as a “scam”.
One of the most interesting indicators of the polarization of American culture is this graphic from the Pew Research Center, revealing the gradual but inexorable polarization of the electorate and the phenomenon of straight-ticket voting:
From their report:
The alignment of Senate races with presidential voting patterns is a fairly recent phenomenon. In 1980, for instance, Democrats won Senate seats in 12 of the 31 states that held Senate races and were carried by Republican Ronald Reagan. (Reagan won all but six states that year; two of those states elected Republican senators despite going for Jimmy Carter, the Democratic incumbent, for president.) In the 1982 midterms, Democrats won 17 of the 28 Senate contests held in states Reagan had won two years earlier.
The “mismatch rate” – the percentage of Senate races won by an opposite-party candidate to a state’s most recent presidential vote – peaked at nearly 59% in 1986. That year, Democrats won back control of the Senate two years after Reagan’s 1984 landslide reelection, in which he won every jurisdiction except Minnesota and the District of Columbia. Of the 34 Senate races that year, Democrats won in 20 states Reagan had won two years earlier.
Since the late 1980s, however, the mismatch rate has generally trended lower. In 2012, the same year Barack Obama won 26 states in his reelection, the mismatch rate was about 18%. Of the 38 regular and special Senate elections held in the 2013-14 cycle, all but three mirrored the 2012 presidential vote, for a mismatch rate of just under 8%. (The three exceptions all were Republicans elected to Senate seats in Obama states.) In 2016, all 34 Senate contests tracked the presidential vote in their respective states.


